
AI Deciphers Ocean Colour to Better Understand Phytoplankton
- 18 September 2026
- Category: News
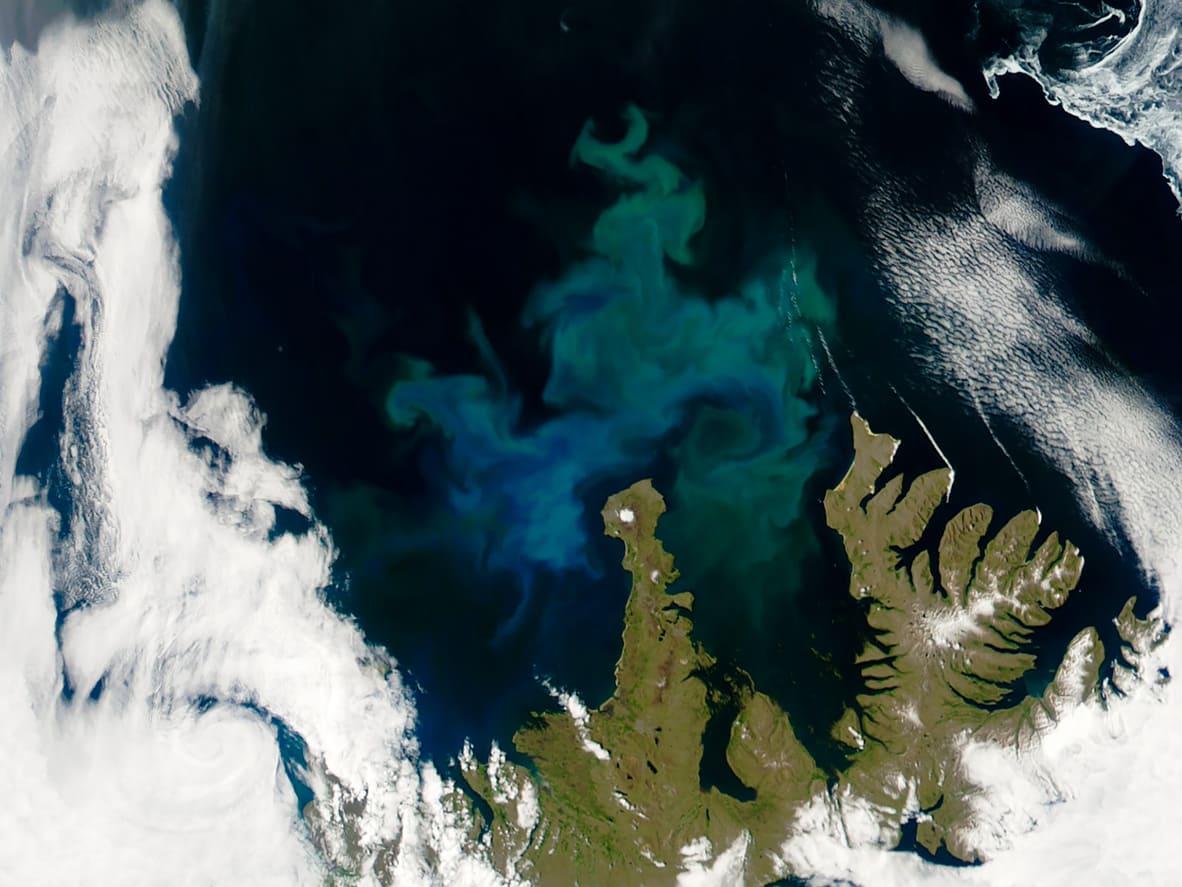
At the base of marine food webs, phytoplankton plays a central role in the functioning of ocean ecosystems. Its distribution and composition change in response to environmental conditions. Observing these changes at a large scale can therefore provide valuable information on the state and dynamics of the ocean.
Satellite ocean colour observations provide a way to monitor some of these parameters across vast areas. But beyond the amount of phytoplankton present, its size structure also provides important information. This more detailed characterisation is at the heart of the work carried out by CLS, using artificial intelligence to exploit Earth observation data.
Satellite data to characterise different phytoplankton size classes
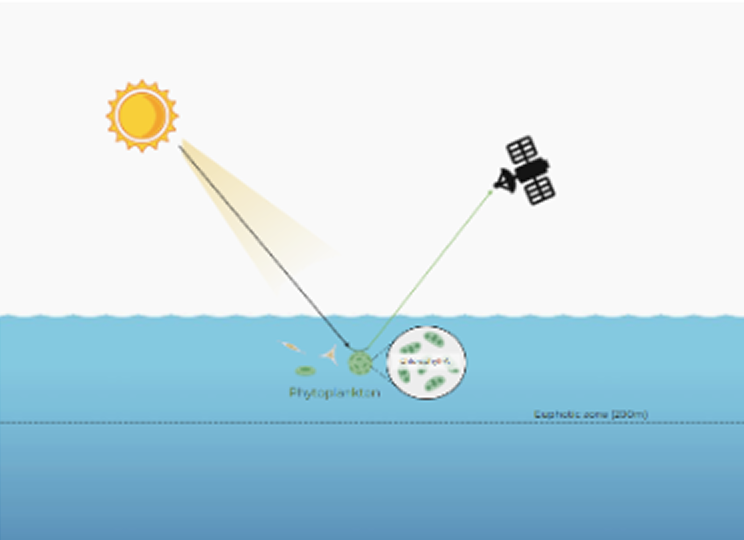
Light entering the ocean interacts with the various constituents present in the water before some of it is reflected back towards the surface. Phytoplankton pigments, particularly chlorophyll-a, absorb certain wavelengths and scatter others, thereby altering the colour of the light emerging from the ocean. It is precisely this colour, and its variations, that is studied through “ocean colour” observations. The resulting measurements can then be used to extract information about the phytoplankton present in surface waters.
Satellite data can be used to observe chlorophyll-a concentrations, which are widely used as an indicator of phytoplankton biomass. However, the same concentration does not necessarily mean that the phytoplankton communities present are identical.
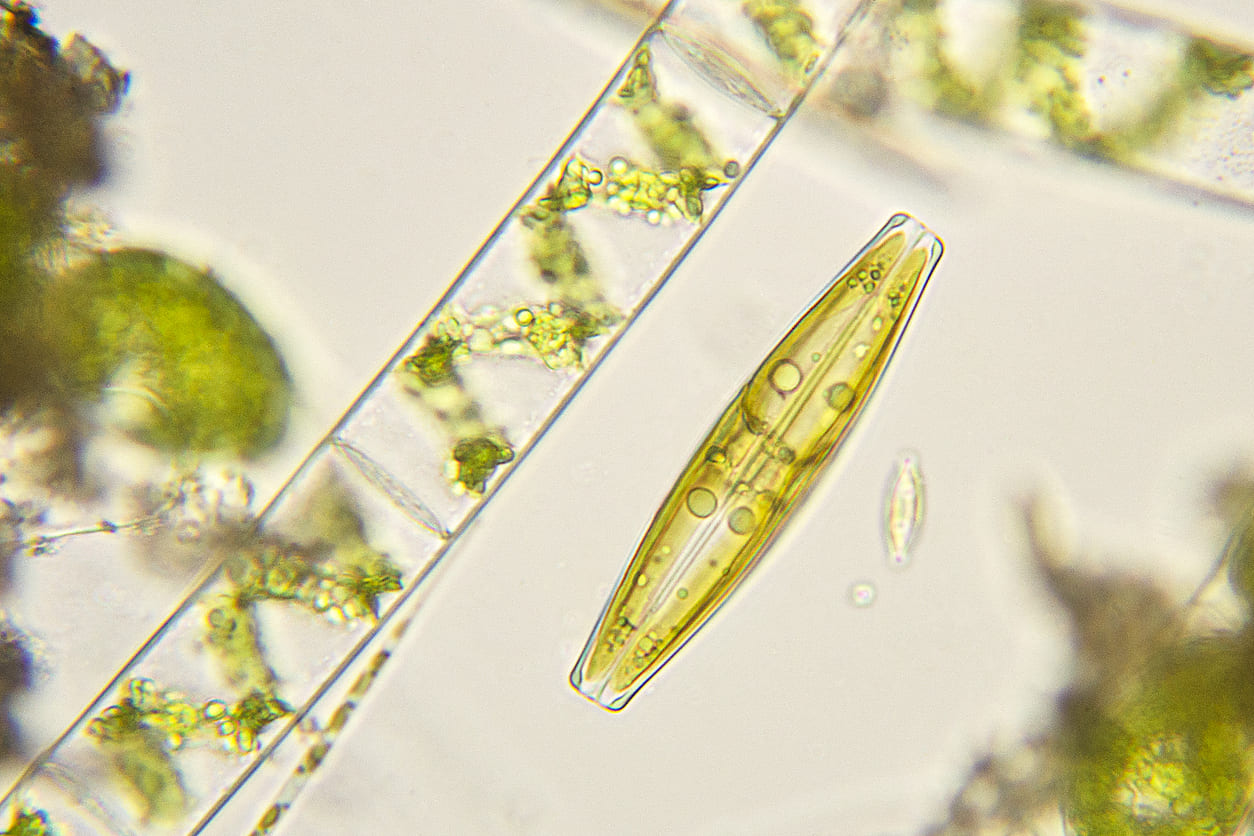
Phytoplankton size provides additional information on the structure of these communities. Different size classes can be distinguished, from picophytoplankton, smaller than 2 µm, through nanophytoplankton, between 2 and 20 µm, to microphytoplankton, between 20 and 200 µm. These different classes do not all play the same role in marine ecosystems. Distinguishing between them can help us better understand how they evolve over time and how these changes may affect marine food webs.
In this study, microphytoplankton is of particular interest because of its efficiency in transferring energy to higher trophic levels. Monitoring its distribution can therefore provide new information for exploring the links between the marine environment and fisheries resources.
Using artificial intelligence to observe phytoplankton at a global scale
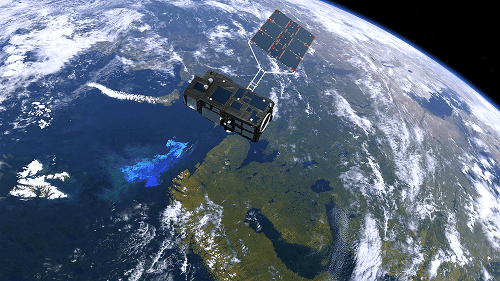
The study of phytoplankton size classes from ocean colour observations builds on methods developed over several decades. CLS’s work* draws in particular on a method proposed by Kostadinov et al. in 2009, adapted to observations from Sentinel-3 and its OLCI instrument (Ocean and Land Colour Instrument). This method uses the optical properties of water to estimate the distribution of different phytoplankton size classes.
Applying this physical method to large volumes of satellite data requires significant processing time. To accelerate this process, CLS trained an artificial intelligence model to reproduce the results of the physical method. The results were then compared with in situ measurements collected at sea, using a database covering the period from 2017 to mid-2025. This comparison helps assess the ability of the approach to retrieve the different size classes observed in the field.
Initial results show that the AI model can reproduce the estimates of the physical model while significantly improving processing efficiency. The approach nevertheless remains dependent on the quality of the available data and on the performance of the initial physical method. The aim is ultimately to achieve processing speeds that enable global, daily monitoring of phytoplankton size classes.
*Work carried out by Léa Schamberger, Jihwan Kim, Maxime Lalire, Camille Keisser and Vincent Laborde, as part of CLS’s Fisheries Resources teams.
Combining phytoplankton data with fisheries catch data
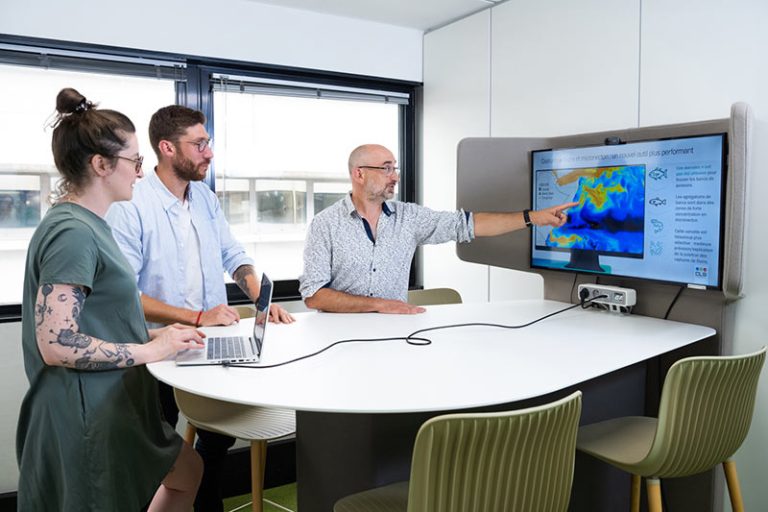 The value of this information can also be explored alongside fisheries data. Phytoplankton forms the first level of many marine food webs, meaning that changes in its distribution and structure can be considered alongside other observations of the ecosystem.
Combining phytoplankton size-class data with fisheries catch data makes it possible to explore relationships between observed environmental conditions and the distribution of fisheries resources.
The objective is not to establish a direct relationship between the presence of phytoplankton and fish catches. Trophic interactions are complex and their effects may appear after a time lag. CLS’s work notably explores the time between a phytoplankton proliferation and the presence of top predators. Combining these datasets therefore opens up new possibilities for understanding the links between phytoplankton dynamics and fisheries resources.
CLS to present its work at Ocean Optics XXVII
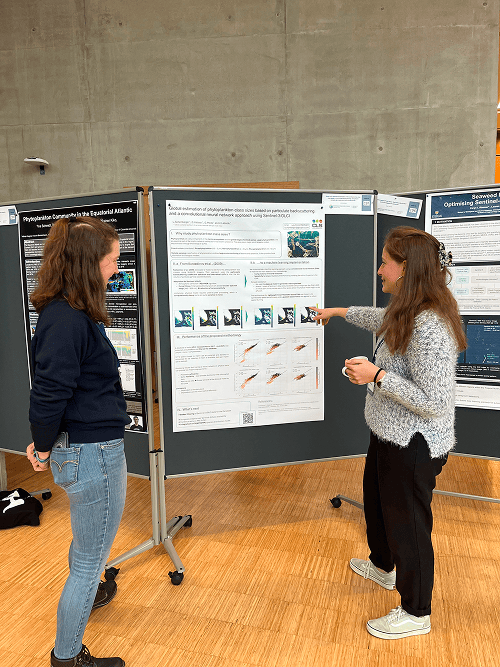
From 14 to 18 September 2026, CLS will participate in Ocean Optics XXVII in Ghent, Belgium, an international conference bringing together the scientific community and experts working in aquatic optics. Earth observation scientists and oceanographers will gather to share the latest advances in the field.
CLS will present its work and the opportunities offered by combining ocean observation data with fisheries data to better understand the relationships between phytoplankton and fisheries resources.
Meet CLS at Ocean Optics XXVII in Ghent in September 2026
Scientific references
Kostadinov, T. S., Siegel, D. A. & Maritorena, S. (2009). Retrieval of the particle size distribution from satellite ocean color observations. Journal of Geophysical Research: Oceans.
Ronneberger, O., Fischer, P. & Brox, T. (2015). U-Net: Convolutional Networks for Biomedical Image Segmentation. International Conference on Medical Image Computing and Computer-Assisted Intervention.